Who Wins the Groza? A College Kicker Analysis

College football postseason awards are notorious popularity contests, often ignoring the sport’s less wealthy and less prestigious programs.
The Heisman Trophy, for example, claims to honor college football’s “Top Player,” but a more apt descriptor is “The Top Quarterback, or occasionally Wide Receiver or Running Back, at a Power Conference school.”
The sport still has at least one properly meritocratic award, however. The Lou Groza award, given annually to college football’s best kicker, tends to be much less enamored with prestige, rewarding the most statistically deserving players much more frequently.
For instance, over the past ten years, Groza finalists (top three) had much more non-power conference representation than the Heisman’s own top three vote-getters:
| Groza vs. Heisman Finalist Makeup (2016-2025) | ||
|---|---|---|
| Groza | Heisman | |
| Non-Power Conference Finalists | 8 | 1 |
| Non-Power Conference Winners | 2 | 0 |
| Non-Power Conference Finalist Representation % | 33.3% | 4.2% |
Granted, evaluating kicker performance is much simpler than with skill positions. Field goals are a mostly isolated and objectively assessable effort — you either make them or don’t.
Non-power conference kickers also tend to be relatively higher caliber players than their peers at other positions. But due to few dedicated roster spots and low positional churn, the handful of three-star kickers out of high school every year are surprisingly well-distributed between power and non-power schools.1
While it’s still far from a majority, the fact that a full third of recent Lou Groza winners have come from programs that have been regularly marginalized by college football’s ruling class feels pretty progressive!
Other evidence further reinforces that choosing the best kicker each season is a relatively merit-based exercise, insulated from the factors — like school and conference affiliation, and number of College GameDay segments — that influence other awards:
- Twenty-two years over the past 25 the consensus All-American for the placekicker position has been a Groza finalist or winner. Contrast that to the many QB-specific awards (Davey O’Brien, Unitas Golden Arm, Manning, first-team All-American, and ostensibly the Heisman) which rarely name the same winner every year, even though, logically, if you were considered the best at your position for one award, you should win all the others, too.
- The Groza voting pool consists of “over 300 experts” that include “FBS coaches, SIDs, media members, former Groza finalists, and current NFL kickers.” LouGrozaAward.com does not offer a breakdown on these voters’ conference affiliations. But with so many voters who either kick, have kicked, or look at kicker stats more frequently than 99.9% of the planet, I don’t think it’s unreasonable to suggest that the Groza pool’s makeup helps mitigate potential Big School Bias2. By comparison, the 930-person voting pool for the 2025 Heisman was 94% media members (many of whom probably never played any ball past high school, if at all).
- The Groza organizers occasionally give glimpses into their selection process, which seems to rely heavily on objective data. In compiling their 2025 pre-season Watch List release, they stated their criteria as:
- “all 11 returning FBS kickers who made more than 20 field goals last season”
- “all 4 returning FBS kickers who attempted at least 15 field goals and made them at a 90% rate”
- “9 returning kickers with at least 9 field goals from 40+ yards while still connecting at 80% or better overall”
Actual, numeric parameters for success! However, a paragraph later they do concede that this list is meaningless, citing the fact that the previous year’s winner (Louisiana’s Kenneth Almendares) did not make the pre-season list as “proof that the Groza Committee will in fact be watching all FBS kickers throughout the season, as all FBS kickers remain eligible to be selected as semifinalists.” Regardless, it’s refreshing to see objective criteria highlighted front and center for an award.
So if we accept all of this as confirmation that the Groza Award is a) hype-proof, and b) largely determined by real, quantifiable performance, just how good of a kicker do you need to be to win the Groza?
Timeout!
If you want to skip ahead and just see what a kicker needs to do to have a high chance of winning the Groza (and a really cool calculator to play around with!), click here. If you’re a college football internet oldhead, this is basically the Heismandments for kickers.
Otherwise, keep reading and we’ll go on a numbers journey together.
Data Collection Summary and Goals
To answer the question, “Who wins the Groza?”, I collected as much data as I could find on Groza winners, runners-up, and other consensus All-American kickers from 2000-2025.
My goals were to:
- establish a statistical floor that must be cleared to win the award
- determine the probability of winning based on performance in specific statistical categories
- develop a criteria and scoring rubric I can use to validate historical winners and help predict future ones
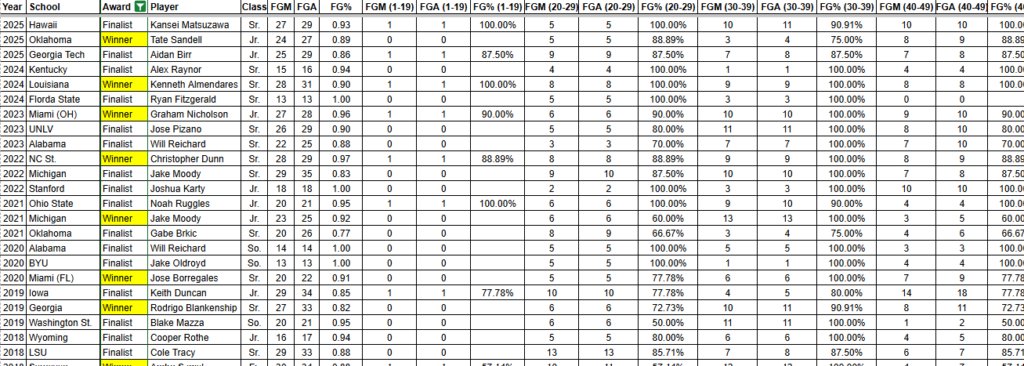
My data set captured 28 data points apiece for 70 kickers. This includes the obvious performance and range metrics, along with information like academic class, conference status, and team wins. The entire data set can be seen here:
Limitations and Assumptions
The most accurate way to answer my question would have been to compare the winners and runners-up against an average FBS kicker for that season. This would account for down years in which the Groza recipient’s performance was not as strong compared to winners from past seasons, but still outperformed the field. While being a more accurate method, it’s also probably overkill and would require way more time than I’m willing to spend.3
It’s also worth mentioning that my method sometimes unfairly assumes that the three finalists each season, off which I am building my entire model, were very clearly the three best kickers in all of college football. Statistically, there’s no real reason Ole Miss’ Lucas Carneiro couldn’t have been a runner-up over Hawaii’s Kansei Matsuzawa or Georgia Tech’s Aidan Birr in 2025, other than there can be only three finalists.
There were also a few other areas where I cut some corners or wasn’t as thorough in my research as I would have liked to be:
- Pre-2004 data: The last year I found complete statistical data for both the Groza winner and at least one runner-up was 2004. I did find complete data for the 2001 and 2003 winners, but not 2002’s Nate Kaeding. I also found basic FG% and XP% stats for the Groza winners from 1992-2000, but yardage range data does not seem to exist anywhere obvious or convenient for these guys, so they were not included in the analysis.
- Postseason data: My data set includes bowl and College Football Playoff games. Since these games are typically played after the Groza is awarded in mid-December, the numbers you see for a player may not be exactly the same as the numbers used by the committee when voting. In most cases, these games represent <8% of a player’s season, so I don’t think it completely sullies my sample. My gut also tells me that teams go for it more often on fourth down vs. kicking field goals in low-stakes bowl games.
- Missed FG/XP cause: Similarly, I did not adjust for kicks missed due to weather conditions, poor snaps, botched holds, or broken blocking (and I suspect that Groza voters do not dig into this, either).
- Groza Moments: I did not factor in game-winning or otherwise big-moment field goals made throughout a season. In addition to there not being a simple way to do so, the fact that we’ve seen non-power conference kickers win in the recent past4 makes me comfortable in saying that a single big kick isn’t enough to put one kicker over another that is statistically superior.
- Myself: The only math classes I took in college were Math 075 (yes that’s a 0) and Stats 150. I got a B-minus in the former and a C in the latter. If you took classes more advanced than those and are reading this, you can probably tell! I tried to stick to what I can handle here (read: averages) but if you see anything extra dumb please let me know.
- 2020: Not unrelated, I did not adjust for the COVID-shortened season because it’s only three kickers in a much larger data set and, most importantly, I don’t know how to do that.
Overall though, I’m confident that a complete data for 70 kickers is a large- and valid-enough sample size for this exercise.
Establishing a Statistical Floor
In the first column of the table below, you’ll see 17 kicker stat categories. The second and third columns show two thresholds established by Groza winners from 2001 and 2003-2025:
- Minimum: The bare-minimum threshold to win the Groza. Players have won with these numbers, but they were outliers.
- Ideal: The benchmark that 90% of winners have exceeded. Basically, the average once the bottom three outliers are removed from each stat category.
Historically, to even be considered for the Groza in a given year, you must meet or clear all of the numbers in the Minimum column. Then, the more benchmarks you meet or exceed in the Ideal column → the greater your chances of winning the award.
| Historical Thresholds for Winning the Groza (2001-2025) | ||
| Stat Category | ✔️ Minimum | 👑 Ideal (Top 90% Average) |
| FG% (Total) | 81.8% | 91.46% |
| FGM (Total) | 15 | 24 |
| FGA (Total) | 16 | 27 |
| FGM (1-19) | 0 | 1 |
| FG% (1-19) | 57.14% | 96% |
| FGM (20-29) | 3 | 7 |
| FG% (20-29) | 40% | 89.62% |
| FGM (30-39) | 2 | 8 |
| FG% (30-39) | 66.7% | 96.51% |
| FGM (40-49) | 2 | 7 |
| FG% (40-49) | 40% | 89.62% |
| FGM (50+) | 0 | 3 |
| FG% (50+) | 0% | 83.32% |
| Long | 47 | 55 |
| XP% | 94.6% | 99% |
| FGM Per Game | 1.3 | 1.9 |
| Total Points | 79 | 119 |
| Team Wins | 2 | 9 |
Determining What Separates Winners from Finalists
The above was calculated using only the data from Groza winners.
To see if Groza winners typically perform better than the runners-up they beat out, I compared the numbers for both groups in a separate table below. In the runners-up group, I also included any consensus All-Americans who were not Groza finalists.
This comparison reveals whether Groza winners performed better than runners-up on average, or if the statistical correlation for winning is weak. It also gives us insight into which statistics are more heavily weighted by the Groza committee and voting pool, and which are largely ignored.
For the reasons stated in the previous section, the years covered for each category of kicker vary slightly.
| Performance Comparison Between Groza Winners and Finalists | |||
| Stat Category | Runners-Up Avg. (2004-2025) | Winner Average (2001, 2003-2025) | Difference |
| FG% | 87.61% | 90.43% | 2.82% |
| FGM | 22.04 | 23.33 | 1.29 |
| FGA | 25.50 | 25.92 | 0.42 |
| FGM (1-19) | 0.28 | 0.54 | 0.26 |
| FG% (1-19) | 81.37% | 86.05% | 4.68% |
| FGM (20-29) | 6.78 | 6.42 | -0.37 |
| FG% (20-29) | 82.12% | 84.96% | 2.84% |
| FGM (30-39) | 6.65 | 7.63 | 0.97 |
| FG% (30-39) | 91.00% | 93.26% | 2.26% |
| FGM (40-49) | 6.02 | 6.67 | 0.64 |
| FG% (40-49) | 81.72% | 84.96% | 3.24% |
| FGM (50+) | 2.24 | 2.58 | 0.34 |
| FG% (50+) | 72.60% | 74.57% | 1.97% |
| Longest | 52.70 | 53.83 | 1.14 |
| XP% | 98.75% | 98.52% | -0.23% |
| FGMPG | 1.72 | 1.84 | 0.12 |
| Total Points | 110.28 | 115.00 | 4.72 |
Historically, it is clear: Groza winners performed better in 15 of the 17 categories than their runners-up. This finding may not seem groundbreaking, but again, it is refreshingly merit-based compared to other postseason awards5.
From here, we can drill down and infer which statistical categories are and aren’t important.
NOT IMPORTANT
- Total Points: Though winners score more than runners-up, the difference of 4.72 points on average does not seem noteworthy, and like XPM, seems largely dependent on the kickers’ respective offenses. It reflects a kicker’s success in other, more specific categories, which is why I am going to exclude total points from my “official” criteria.
- FGA: The difference in attempts between winners and runners-up was miniscule (0.42). While clearing the historical baseline for attempts probably has some importance, this stat category suggests (perhaps unfairly) that a kicker’s number of attempts does not matter as long as their FG% is high.
- XPs: If every kicker took the same number of attempts from the exact same distance and location every game, we’d have a near-perfect metric to judge kicker performance (variable weather and teammate factors notwithstanding). Extra points are, in theory, a nice standardized metric for comparison, but because they are kicked from gimme distance, voters don’t seem to care, as shown by Groza winners being 0.23% less accurate than runners-up.
- FGM (<29 yards): The only other instance in which the average Groza runner-up outperformed the average winner was FGM (20-29). This category suggests that the committee isn’t really looking at what kickers do when their OCs are too cowardly to go for it near the red zone. And because so few kickers attempt field goals in the 1-19 yard range, I also excluded that category from analysis.
- FG% from specific distances: The largest gaps between winner and runner-up performance were all FG% related: from 50+ yards (1.97% difference); 40-49 yards (3.24%); 30-39 yards (2.26%); 20-29 yards (2.84%); and overall FG% (2.82%). Still, except for overall FG%, I decided to not include these categories in my final criteria. If a kicker is clearing the thresholds for overall FGM, they are almost certainly getting opportunities from a variety of distances. Likewise, if they are missing frequently from 30-40 yards, they very likely aren’t getting trotted out for those longer kicks that seem to matter more to voters. Similarly, as FG distance increases, success probability and expected points decrease, which is to say that shorter kicks aren’t as big of a deal. Also, having 10+ criteria makes a tracker unwieldy and stymies the simplicity I am looking for here.
- Team Wins: I did not include in the table above, but virtually the same on average between winners and runners up (7.96 vs. 7.89). Although a Groza recipient’s team hasn’t won fewer than eight regular season games since 2017, we’ve seen finalists’ teams with just two, three, and four wins in the past five seasons. Due to the individual nature of the position, it doesn’t feel impossible for a kicker to win the award on a crap team if he has a stellar year.
- Academic Class: Juniors and seniors have won 75% of Grozas historically (1992-2025), but this majority is likely explained by selection bias rather than voter bias: there simply weren’t as many elite underclassmen competing for the award. It’s also probably not outlandish to say that kickers who have kicked for more years in college are statistically better kickers. Regardless of the true reason, if an underclassman compiles elite-level statistics and hits the thresholds above, there’s no evidence voters would penalize them based on class alone (see: freshman winner Andre Szmyt in 2018). So rather than excluding younger kickers from contention, despite how the data trends, I’m trusting that hitting the performance benchmarks is what matters most.
IMPORTANT
- FGM and FG%: These are obvious, though I toyed with not even including FG% since one could argue it’s embedded in FGM. Maybe someday we’ll see how the committee feels about a kicker with 35 makes at only a 70% clip.
- FGMPG: Field Goals Made Per Game is a stat that CFBStats.com includes on its kicker page. Most Groza winners led or were very close to the top of the list in this category for their respective seasons, making me briefly think I had unlocked a profound Truth (and a way to make this writeup about 2,000 words shorter). But the miniscule difference between winners and runners-up (0.12) suggests that this criterion is more important to help separate finalists from the field as opposed to winners from runners-up. Still, needing to average at least 1 FG per game feels like an important (and not unreasonable) line to draw.
- FGM (50+) and Longest: Finally, despite only marginal difference between winners and runners-up, only two kickers since 2008 have made it to the Groza award ceremony without at least one FGM from 50+ yards. Given this, and that kicks from 50+ are being made with more frequency, I’m going rogue from the data and mandating that a kicker must bang one home from this distance to be considered for the award in our modern era. It might seem redundant to include both of these categories, but Longest enhances our resolution a bit. Without it, a 50+ yard field goal would count on paper the same as a record-breaking 70-yarder. It also doesn’t feel unreasonable to think that raw distance could serve as a tiebreaker in a year when the other stat categories are a toss-up between finalists.
The Laws of Lou: What It Takes To Win the Groza

After running all of that data through our kicking centrifuge, we are left with five laws a kicker must abide by to be considered for — and win — college football’s premier placekicking prize:
- Kick at least 15 FGs, but ideally 24 or more
- Make at least 81.8% of FG attempts, but ideally 91.46% or more
- Average at least 1.1 FGs made per game, but ideally 1.79 or more
- Make at least one FG from 50+ yards, but ideally two or more
- Make your longest FG from at least 47 yards out, but ideally from 55 yards or more
Now to see if these kicking commandments hold water retroactively, let’s turn this checklist into a simple scoring system we can use to track kicker performance throughout a season:
> Meeting or surpassing a Minimum category threshold= 1 Groza Point
> Meeting or surpassing an Ideal category threshold= 2 Groza Points
Under this scoring system, 10 is the maximum score if a kicker reaches the “Ideal” threshold in all five categories (5 categories x 2 points = 10). If this doesn’t make sense, it will when you play with the calculator tool below.
Applying this scoring system retroactively from 2004-2025, we see that:
- The average score for winners is 7.63, vs. 6.52 for runners-up.
- Nine kickers (including two runners-up) have reached 9 points, but no one has ever hit a perfect 10.
- The lowest score for a winner was 5, happening twice:
- in 2005, when runner-up and future Super Bowl champion Mason Crosby outscored the winner (Oregon State’s Alexis Serna) by one point.
- in 2006, when consensus All-American Justin Medlock (who was not a Groza finalist) and Groza runner-up John Vaughn outscored winner Arthur Carmody by three points and two points, respectively. This apparently funky kicking year was the only time the winner was outscored by more than one point.
- in 2005, when runner-up and future Super Bowl champion Mason Crosby outscored the winner (Oregon State’s Alexis Serna) by one point.
- On nine occasions, the Groza winner tied with at least one runner-up (2004, 2007, 2010, 2011, 2012, 2014, 2015, 2022, and 2023)
Said more simply: Every season since 2015, the Groza winner has tied or outscored the runners-up on this rubric. And since 2006, no non-winner has outscored the Groza winner by more than a single point. Not bad!
Let’s evaluate this model further by looking at how frequently those who tallied four or more points actually won the award:
| Win Rates Per Point Total (on Groza Grid rubric) | |||
|---|---|---|---|
| Score | Winners | Runners-Up | Win Rate |
| 9 | 7 | 2 | 77.8% |
| 8 | 8 | 13 | 38.1% |
| 7 | 3 | 10 | 23.1% |
| 6 | 2 | 10 | 16.7% |
| 5 | 2 | 5 | 28.6% |
| 4 | 0 | 5 | 0% |
Except for the weird bump down at five points, this makes sense: the more Groza Points you score, the higher your chances of winning.
Note that win rate is negatively skewed by seasons when there are two- or three-way ties among the top kickers. In other words, win rate calculates tied runners-up as losses, even when they had the same score as the winner.
If we remove seasons when there were ties (assuming that choosing a winner is essentially a toss-up at that point) and only look at seasons where there was a clear Groza Points leader, the win rates are boosted at the top levels:
| Win Rates Per Point Total, Years With a Clear Points Leader (on Groza Grid rubric) | |||
|---|---|---|---|
| Score | Clear Winners (No Ties) | Runners-up | Adjusted Win Rate |
| 9 | 5 | 0 | 77.8% → 100% |
| 8 | 4 | 4 | 38.1% → 50% |
| 7 | 0 | 3 | 23.1% → 0% |
| 6 | 1 | 5 | 16.7% → 16.7% |
| 5 | 0 | 3 | 28.6% → 0% |
| 4 | 0 | 3 | 0% → 0% |
Overall, when a kicker has reached 9 Groza Points—meeting or exceeding the ideal threshold in four of the five key categories—they’ve won 77.8% of the time. In seasons when a 9-point kicker outscored all competition, the win rate is a perfect 100%.
Eight points is the most common score that finalists and non-finalists have tallied, and has historically meant a 50-50 chance of winning. No kicker has ever won outright with seven points or five points, which is why those win rates went down after adjustment.
Although adjustments to this rubric may eventually be needed as kickers continue to improve, right now we can state our Universal Theory of Groza: clear every baseline Minimum on the Groza Grid checklist, excel in several of those same categories, and score at least 8 Groza Points to enter serious contention for the award.
To see more directly how a kicker’s performance determines his chances of winning the award, plug his statistics into this calculator:
Groza Win Probability Calculator
Enter a kicker's season stats to see the likelihood they'll win college football's top placekicking prize.
What’s Next?
I’m excited to use the Grid to monitor kickers’ progress throughout the 2026 season and see how it aligns with the award’s semi-finalist and finalist lists.
Over the summer, I may even try and apply this rubric to as many returning kickers as I can and see how many of them end up on the pre-season watchlist. And since this is the internet, I suppose I should use all of this to make bold proclamations about who you should wager on to win the college kicker trophy.
At the very least, I hope this will be a good (albeit overcomplicated) way to monitor whether the Groza is kowtowing to power conference schools that already have it all, or remaining true to its status as college football’s most egalitarian award.
About this analysis
All of the data gathering and spreadsheet populating was done manually by me, a human. I also typed 95% of the words all by myself. My editor Louis Bien (also a real human as far as I know) provided the rest along with stellar creative direction.
AI was used for: the two images, table styling, model development, creating the calculator, guidance on data quality issues, and many Excel functions I could have looked up in a really big book from the library but didn’t.